
Browse every click and scan in the Events log
One row per click, QR scan or page view in CodeQR Events — country, device, browser, referrer, time — filter from any cell, copy a click ID, export data.
By the end of this guide you will use the Events page to look at individual clicks, scans, and page views — when they happened, from where, on what — and know which ways exist today to take the data out of CodeQR.
Availability
- Plan: Events is complete from Pro. Free and Starter workspaces see example rows behind an upgrade overlay. Through the API,
GET /eventsneeds Pro or above. - Where: Events in the sidebar (also reachable from the icon at the right of the Analytics chart). The Filter and date controls are the same as in Analytics.
Before you start
- Events lists what Analytics counts: one row per click, QR scan, or page view that passed the counting rules (bots excluded, one visitor per 5 minutes per link). It is the place to answer "what happened at 3 pm" rather than "how many".
- The list only shows events of links and QR codes that still exist. When you delete a link, its events leave the log and the top-links card, but the workspace totals keep them.
- Individual visitors are not identified. There is no name, e-mail, or IP address on a click; the IP Address column exists but stays empty because CodeQR does not store it.
Steps
- Click Events in the sidebar. Three tabs at the top — Clicks, Leads, Sales — with a small sparkline each. Clicks is selected and includes link clicks, QR scans, and page views.
- Read the table. Default columns: Event (Click on link, QR Code scan, or Page view), Link, Country, Device, and Date (in your browser's time zone). Newest first; click Date to reverse the order.
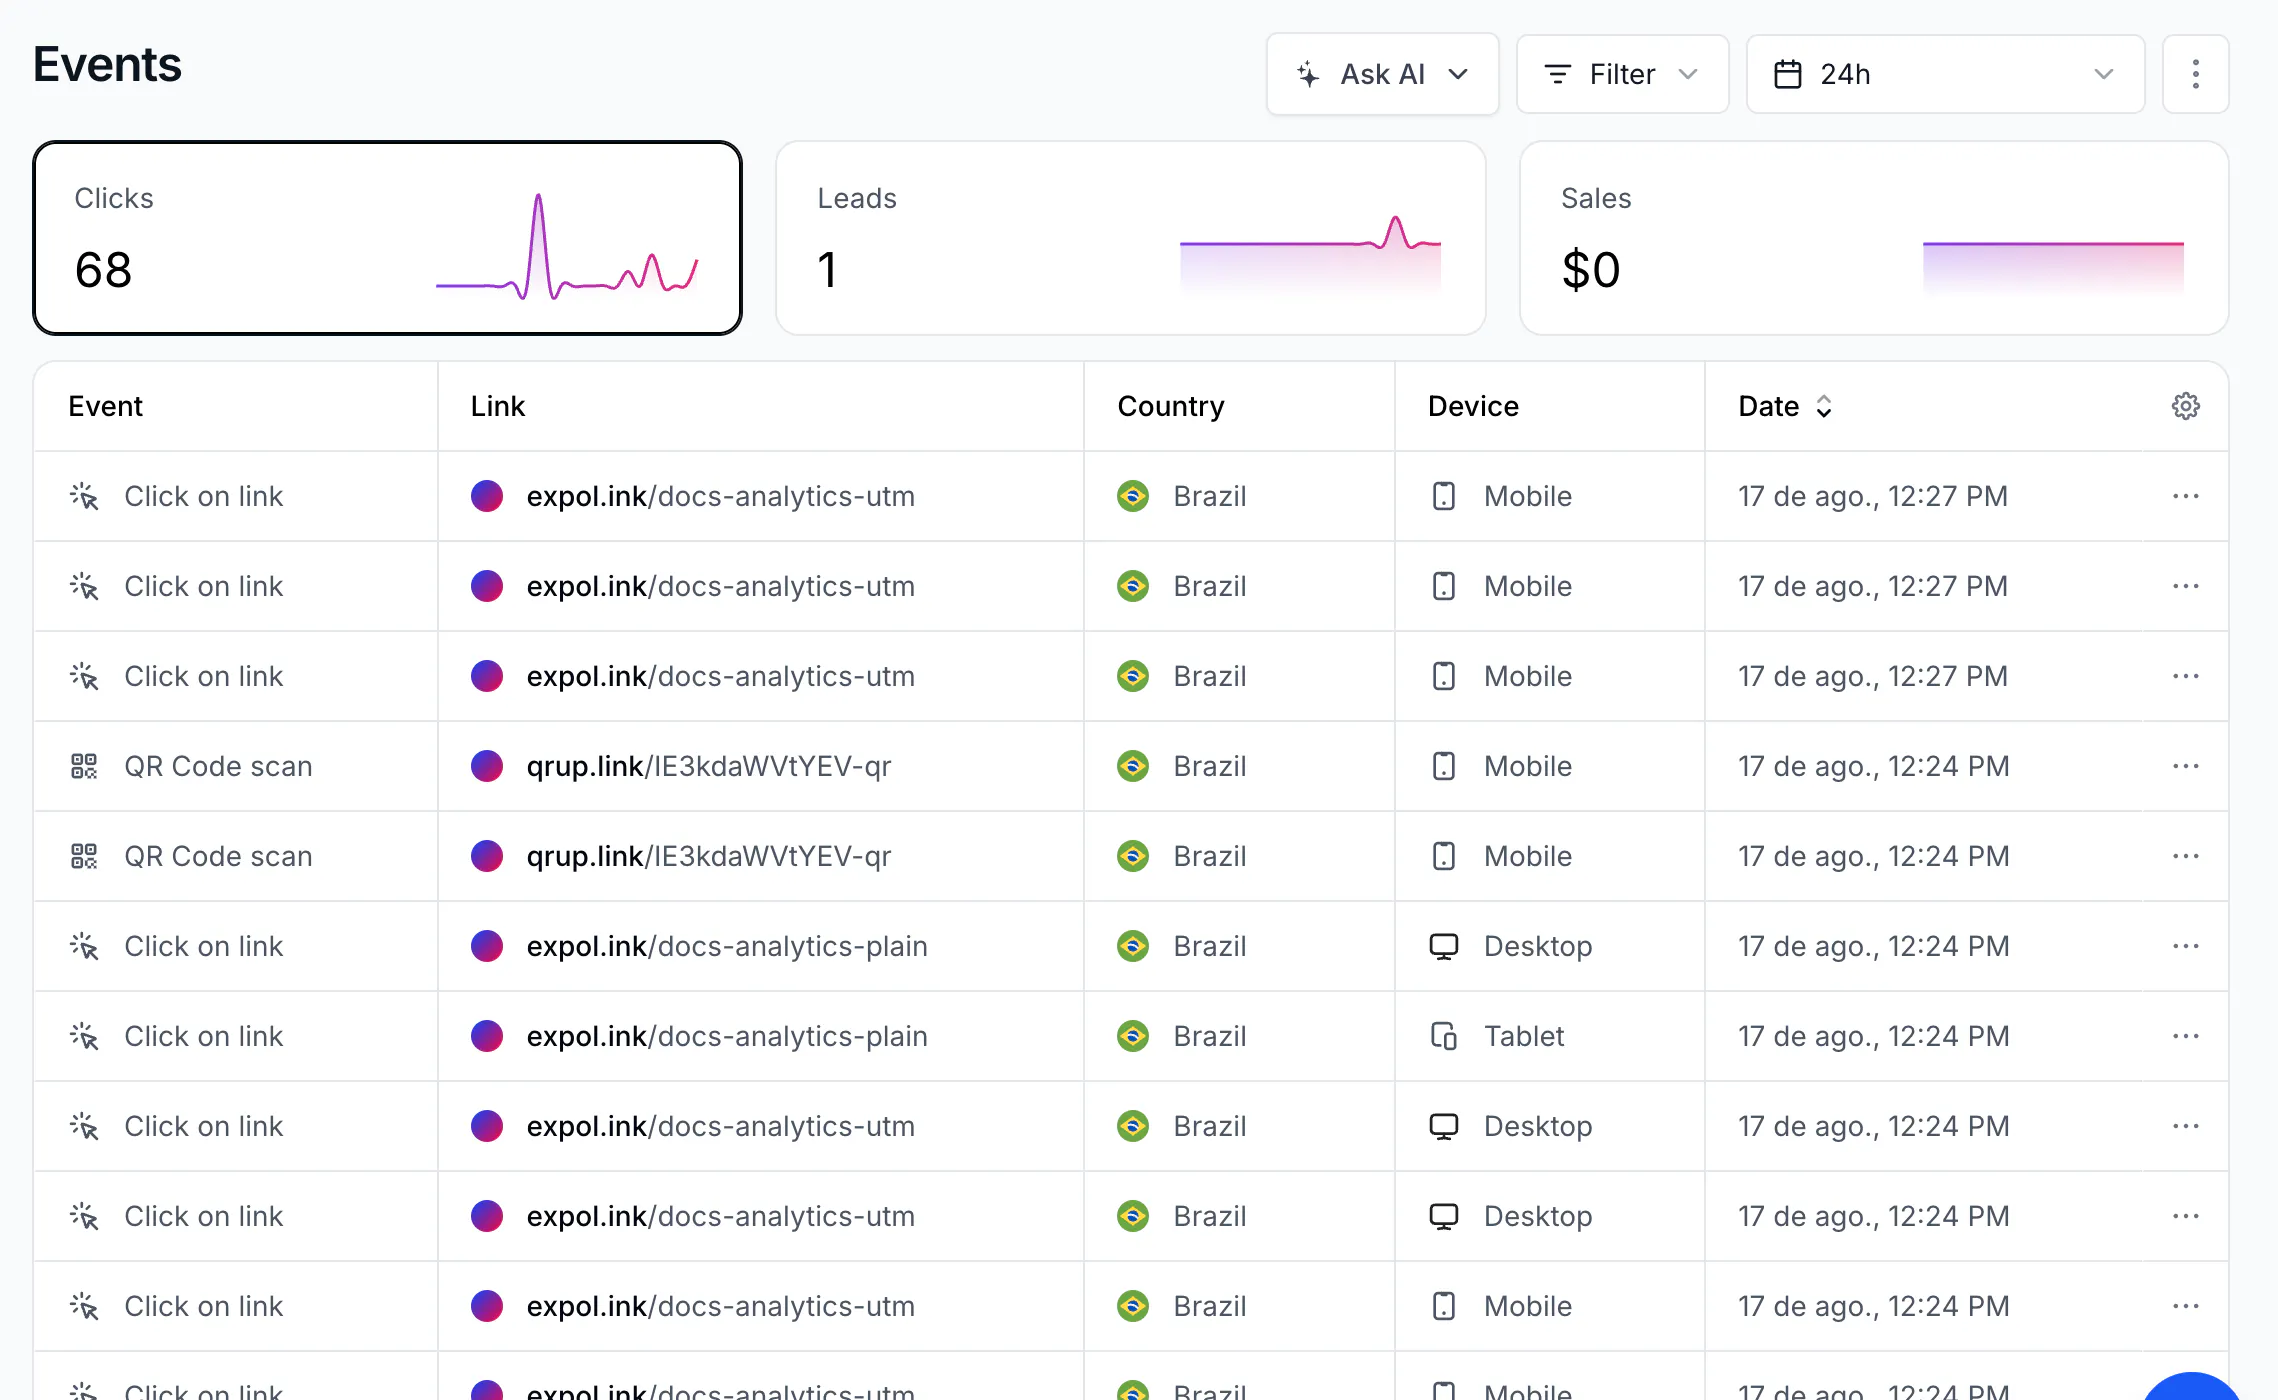
- Click the gear icon at the right of the header to add or remove columns: Link, Continent, Country, City, Device, Browser, Operating System, Referrer, Referrer URL, IP Address.
- Hover a cell and click Filter to keep only rows with that value — the same link, country, or device. The chip appears next to Filter; Clear filters removes it. Filters and the date range work exactly as in Analytics — see Filter analytics by link, tag, and date range.
- Open the ⋯ menu at the end of a row and click Copy click ID to copy the event's identifier (for example
iPjJ1eT6yjCB1mGw). Use it in support conversations or to match a conversion recorded through the SDK. - Use Anterior / Próximo at the bottom to page through the list.
Getting the data out
Today there are three working routes:
- UTM Report → Export CSV: one row per link with UTM parameters, with clicks, scans, and totals — see Measure UTM campaigns on links and QR codes.
- API
GET /events: the same rows as the page, as JSON, withlimit(default 100) andpage, plus every filter and date parameter; addtypes=qrcodefor scans only ortypes=linkfor clicks only. Example:GET https://api.codeqr.io/events?event=clicks&interval=7d&linkId=<id>&limit=100&page=1. Each row includestimestamp,click.country,click.city,click.device,click.browser,click.os,click.referer,click.url, and the fulllinkobject. - MCP
get_analyticsfor aggregated numbers from an AI assistant. Both are described in Read analytics from the API, MCP, and webhooks.
Verify it works
- Open your short link on your phone and wait two to three minutes.
- In Events, the first row reads Click on link, your link, your country, Mobile, and the current time. Add the Browser and Referrer columns: Mobile Safari or Chrome, and (direct) if you opened it from an app.
- Through the API,
GET https://api.codeqr.io/events?event=clicks&interval=24h&linkId=<id>&limit=1returns that row.
Troubleshooting
The page shows sample rows and an upgrade message
Events is available from Pro. Analytics still shows the aggregated numbers on every plan.
The list is shorter than the Clicks counter
Rows belong to links and QR codes that still exist; deleted links leave the log while their events stay in the totals. The pagination text at the bottom follows the counter, not the rows.
I want to filter scans only
Add the Event column filter by hovering QR Code scan in a row and clicking Filter, or set Filter → Trigger → QR scan in the toolbar.
I need a spreadsheet of every click
Use GET /events from a script or a no-code tool and write the rows to a sheet; the UTM Report export is the only CSV download in the app today.