
See which links and QR codes generate sales
Read conversion results in CodeQR — the customer timeline, revenue per link, and which screens are reliable when you need to prove a sale was recorded.
Once leads and sales are arriving, three screens answer three different questions: who converted, which link earned the money, and how the totals moved.
Availability
- Plan: Pro and above for conversion data; Customers requires Business.
- Where: Customers, Events and Analytics in the sidebar.
Who converted — Customers
Customers is the most reliable view and the one to reach for when you need to prove a specific sale was recorded. Select a person and the panel opens with their whole history.
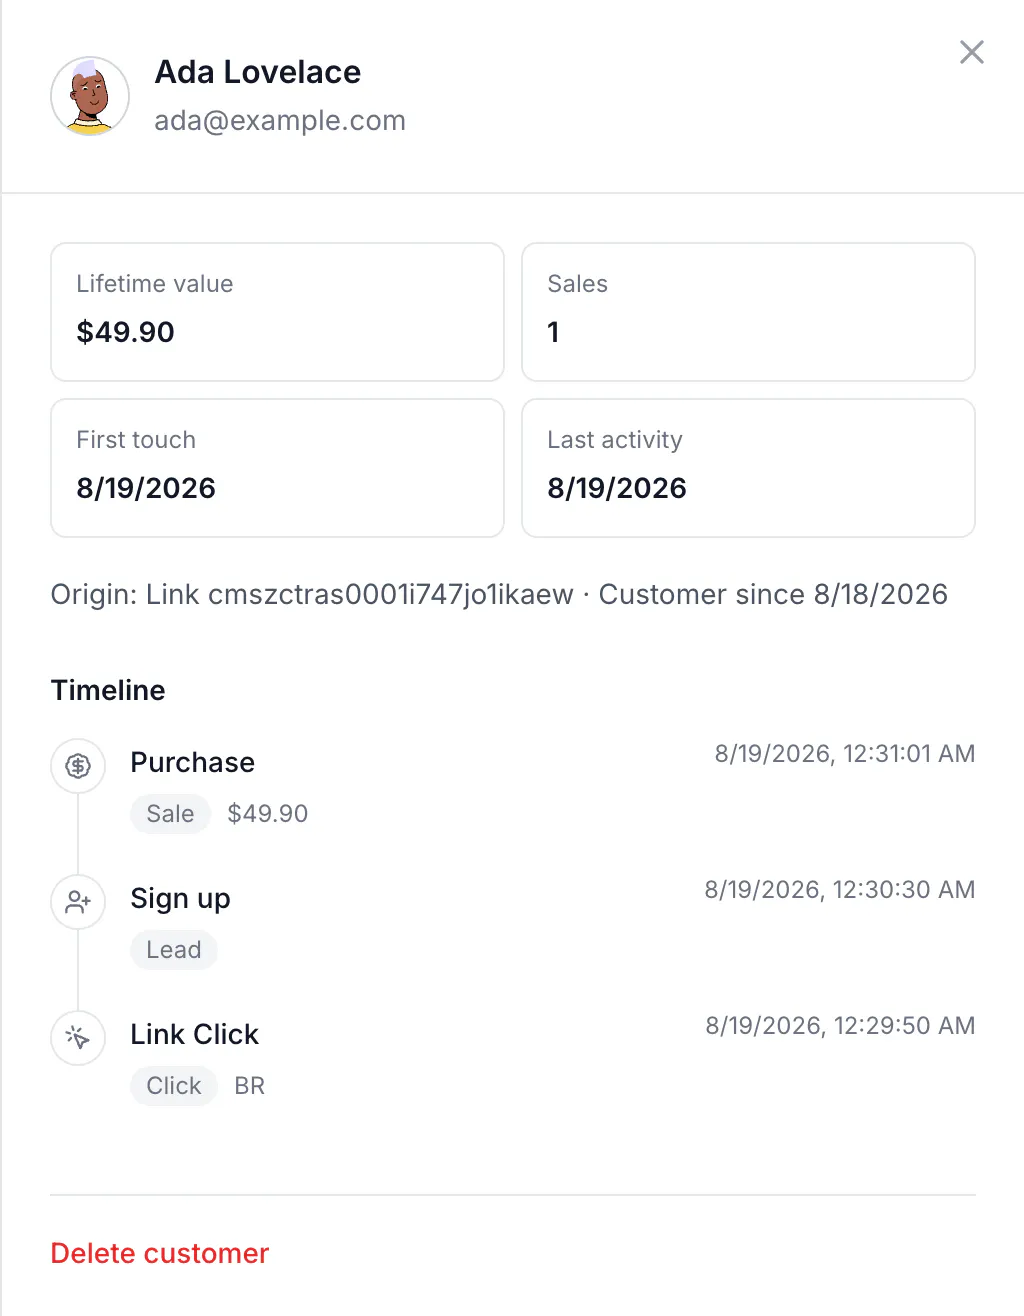
- Lifetime value and Sales — total spent and how many purchases.
- First touch and Last activity — when they arrived and when they were last seen.
- Timeline — every event in order, ending at the click that started it, with the country.
The timeline is what turns an abstract conversion rate into something you can check: click, sign-up, purchase, in that order, with times.
Which link earned it
Each link and QR code carries its own counters. In the list, a link with conversion tracking shows clicks alongside leads, sales and revenue, so sorting by revenue ranks campaigns by money rather than by attention.
The same numbers over the API:
curl -sS "https://api.codeqr.io/links/info?domain=go.example.com&key=summer" \
  -H "Authorization: Bearer codeqr_xxxxxxxxxxxxxxxxxxxxxxxx"
{ "key": "summer", "clicks": 1, "leads": 1, "sales": 1, "saleAmount": 4990 }saleAmount is in cents.
How the totals moved — Events and Analytics
Events shows counters for the period and a list of individual events.

Use the event filter to switch between clicks and leads. The sales list currently fails to load — the counter above it is correct, but the rows below it do not render. Until that is fixed, verify a sale in Customers or through the link counters, both of which are accurate.
Analytics aggregates the same data by period, country, device and campaign, which is where a month-over-month comparison belongs.
What is not counted
- Clicks on the root of a custom domain are not recorded at all, so a domain used as a vanity address shows zero.
- Bot traffic does not produce clicks, and therefore produces no leads.
- A visit with no click id cannot be attributed; the event is accepted and dropped.
Verify it works
The fastest end-to-end check, after wiring everything:
- Open one of your tracked links.
- Complete the action you record as a lead.
- Open Customers — the person is there within a minute, with the click and the lead on the timeline.
If the customer exists but the sale does not, the sale call never arrived; see Send lead and sale events from your server.
Troubleshooting
Customers is empty and clicks are growing
No leads have been reported. Clicks alone never create a customer.
The revenue figure is formatted oddly on Events
The Events counter formats the amount differently from the rest of the product. The value in Customers and on the link is the correct one.
The sales tab shows an error
Known, and being tracked. The counter is right; the list is not.
A customer shows the wrong origin
Origin is the first touch and is never updated, so a customer who arrived through one campaign keeps it even after clicking others.
The numbers do not match my payment processor
CodeQR counts what was reported to it, attributed to a click. A sale with no surviving click id never reaches the report — How CodeQR decides which click gets the sale.